Exercises
Being a detective with data
1. An association in the news
Find a recent news story that describes an association from an observational study.
- Identify the exposure or treatment.
- Identify the outcome.
- Does the headline or story suggest that the exposure causes the outcome? Identify the specific language that suggests (or does not suggest) a causal claim.
- Do you think the association could be causal? Explain why or why not. Consider the timing of the exposure and outcome, the size and pattern of the association, the plausibility of a causal mechanism, and reasonable alternative explanations.
- Identify at least one possible confounder, and explain how it might affect both the exposure and the outcome.
- Determine whether the possible confounder was measured in the study. You may need to consult the original study.
2. Night lights and childhood myopia
Quinn and colleagues studied 479 children seen in a pediatric ophthalmology clinic. Parents reported the lighting conditions in which their children slept during the first two years of life. The table combines the myopia and high-myopia categories reported by the investigators (Quinn et al. 1999).
| Nighttime lighting | Myopia | No myopia | Total |
|---|---|---|---|
| Darkness | 17 | 155 | 172 |
| Night light | 79 | 153 | 232 |
| Room light | 41 | 34 | 75 |
| Total | 137 | 342 | 479 |
Source: Quinn et al. (1999). The table combines the myopia and high-myopia categories reported by the investigators (Quinn et al. 1999).
- Compute the risk of myopia in each lighting group.
- Using darkness as the reference group, calculate:
- the relative risk of myopia comparing a night light with darkness;
- the relative risk of myopia comparing room light with darkness.
- Identify a possible confounder and explain how it might affect both nighttime lighting and childhood myopia.
- Apply the Cornfield condition separately to both comparisons. If the entire association were due to your proposed confounder, at minimum, how much more prevalent would the confounder need to be:
- among children who slept with a night light than among children who slept in darkness?
- among children who slept with room lighting than among children who slept in darkness?
3. Kidney-stone treatment and success
Charig and colleagues compared open surgery with percutaneous nephrolithotomy for treating kidney stones (Charig et al. 1986). We will refer to the latter as the percutaneous procedure. Julious and Mullee later highlighted how the results differed by stone size (Julious and Mullee 1994).
| Stone size | Treatment | Successful treatments | Total patients |
|---|---|---|---|
| Small | Open surgery | 81 | 87 |
| Small | Percutaneous procedure | 234 | 270 |
| Large | Open surgery | 192 | 263 |
| Large | Percutaneous procedure | 55 | 80 |
| All stones | Open surgery | 273 | 350 |
| All stones | Percutaneous procedure | 289 | 350 |
Source: Charig et al. (1986); the comparison by stone size was subsequently highlighted by Julious and Mullee (1994) (Charig et al. 1986; Julious and Mullee 1994).
- Compute the overall relative risk comparing open surgery with the percutaneous procedure.
- Compute the relative risk comparing open surgery with the percutaneous procedure separately for:
- small stones;
- large stones.
- Compare the overall and stone-size-specific results. What changes, and why?
- Even within stone-size groups, other confounding may remain. Name one possible unmeasured confounder. Apply the Cornfield condition to determine how much more prevalent it would need to be among open-surgery patients to explain away the observed association entirely for:
- small stones;
- large stones.
- Are those Cornfield thresholds alone enough to conclude that the within-size associations are causal? Why or why not?
Clinical trials as our exemplar
4. Are these interventions well-defined?
For each proposed trial below:
- Identify the intervention and comparator.
- Explain what, if anything, threatens well-definedness of the potential outcomes.
- Decide whether the concern involves relevant versions of treatment, interference, or neither.
- Describe what you would add to the trial protocol—or to the definition of the intervention—to address the concern.
The scenarios are hypothetical and do not present data from actual trials.
Scenario 1
Adults with hypertension are randomized either to receive a bottle of a new medication or to receive usual care. No further instructions are provided.
Scenario 2
Adults admitted to the hospital with a particular infection are randomized either to initiate an antibiotic sometime during the next seven days or not to initiate it during the next seven days.
Scenario 3
People who smoke are randomized either to receive smoking-cessation counseling or to receive no counseling. Counselors at each clinic decide what to discuss, how many sessions to offer, and how to respond when a participant misses a session or continues smoking.
Scenario 4
Adults are individually randomized to receive a flu vaccine or no flu vaccine. The outcome is whether each participant develops influenza during the following winter. Some participants live in the same household or belong to the same social networks.
Scenario 5
Participants are randomized to receive the same medication, dose, schedule, and instructions. One clinic dispenses the medication in a white bottle and another uses a blue bottle.
5. Complete the potential-outcomes table
A city randomly assigns people seeking employment to one of two programs. Let \(A=1\) denote assignment to an intensive job-training program and \(A=0\) denote assignment to standard job-search materials. Let \(Y=1\) if the person is employed six months later and \(Y=0\) otherwise.
- Describe \(Y(1)\) and \(Y(0)\) in the context of this trial.
- What should we assume about the interventions so that \(Y(1)\) and \(Y(0)\) are well-defined? Explain what that assumption means in this trial.
- Random assignment should make \(A\) independent of \((Y(0),Y(1))\). Explain what this means in this trial.
- Interpret \(E[Y(1)-Y(0)]\) in context.
- Use consistency to complete as much of the table as possible. Enter a question mark for any potential outcome that cannot be determined from the observed data.
| Person | \(A\) | \(Y\) | \(Y(0)\) | \(Y(1)\) |
|---|---|---|---|---|
| 1 | 1 | 1 | _____ | _____ |
| 2 | 0 | 0 | _____ | _____ |
| 3 | 1 | 0 | _____ | _____ |
| 4 | 0 | 1 | _____ | _____ |
| 5 | 1 | 1 | _____ | _____ |
Probability review
6. Best guesses in the emergency department
In a hypothetical emergency department, each arriving patient could need up to three laboratory tests. Each test is independently needed with probability \(1/2\). Let \(X\) be the number of tests the patient needs. Thus,
\[ X\sim\operatorname{Binomial}(3,1/2). \]
In plain language, there are three opportunities for a test to be needed, each with probability \(1/2\), and \(X\) counts how many are needed.
For each needed test, the physician flips a fair coin and orders the test only if the coin lands heads. Let \(Y\) be the number of needed tests that are actually ordered.
- What is your best guess for \(Y\) when you learn that \(X=0\)?
- What is your best guess when \(X=1\), \(X=2\), and \(X=3\)?
- Write the full random variable \(E[Y\mid X]\) as a function of \(X\).
7. Recovering the overall mean
Let \(X\) describe the urgency assigned to a patient arriving at a community clinic. The possible values are \(0\), \(1\), and \(2\), with probabilities
\[ P(X=0)=0.5,\qquad P(X=1)=0.3,\qquad P(X=2)=0.2. \]
Let \(Y\) be the number of follow-up visits the patient makes during the next month. Suppose
\[ E[Y\mid X]=1+2X. \]
- Find the best guess for \(Y\) at each value of \(X\).
- Use the law of iterated expectation to find \(E[Y]\).
8. Conditional means from observed data
A community health program records whether adults received help scheduling a cancer screening appointment. Let \(A=1\) indicate that a person received scheduling help and \(A=0\) indicate that they did not. Let \(X=1\) indicate age 65 or older and \(X=0\) indicate age 40 through 64. Let \(Y=1\) indicate that screening was completed within three months and \(Y=0\) otherwise.
Imagine selecting one person at random from the observed dataset, with every person equally likely to be selected. The table gives the number of people with each combination of \(A\), \(X\), and \(Y\).
| \(X\) | \(A\) |
Completed screening \(Y=1\) |
Did not complete screening \(Y=0\) |
|---|---|---|---|
| 0 | 0 | 18 | 42 |
| 0 | 1 | 32 | 48 |
| 1 | 0 | 24 | 36 |
| 1 | 1 | 45 | 45 |
- Find \(E[Y\mid A=1,X=0]\) and explain what the quantity represents.
- Find \(E[Y\mid A=0,X=1]\) and explain what the quantity represents.
9. Binary outcomes and linearity
At an urgent-care clinic, let \(Y=1\) indicate a positive COVID-19 test and let \(W=1\) indicate a positive influenza test. Let
\[ T=Y+W \]
be the number of positive tests for a patient. Suppose
\[ P(Y=1)=0.12 \qquad\text{and}\qquad P(W=1)=0.08. \]
- Find \(E[Y]\) and \(E[W]\).
- Find the expected number of positive tests, \(E[T]\).
Now let \(X=1\) indicate that the patient has a fever at arrival. Among patients with a fever, suppose
\[ P(Y=1\mid X=1)=0.30 \qquad\text{and}\qquad P(W=1\mid X=1)=0.10. \]
- Rewrite these two conditional probabilities as conditional means. Then, find \(E[T\mid X=1]\).
- Do we know if \(Y\) and \(W\) are independent? What about \(Y\) and \(X\), or \(W\) and \(X\)?
10. Drawing a conditional mean
The scatterplot shows independent and identically distributed observations of age \(X\) and systolic blood pressure \(Y\) from a hypothetical population.
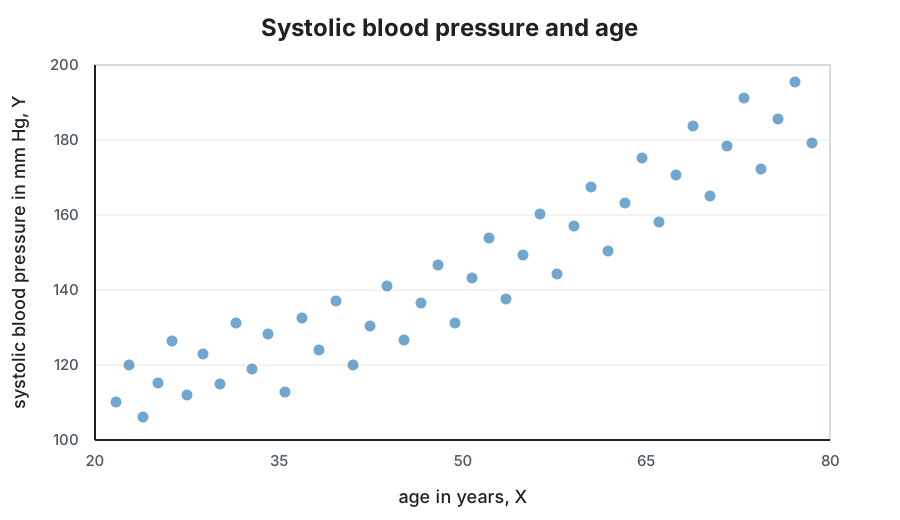
- Draw a curve that represents your best estimate of \(E[Y\mid X]\).
- Would a straight line provide a reasonable model for the conditional mean? What other functional form might you consider?